

Trust your /data
Metaplane is the best-in-class data observability platform for enterprise companies.


What is monitoring and anomaly detection?


Be proactive
Be the first to find every data quality issue in your stack
Build trust
Create better relationships with data team stakeholders
Reduce stress
Reduce anxiety related to unknown unknowns
How monitoring and anomaly detection work
Quickly add monitors without writing code
Suggestions and usage icons highlight where to place monitors
Set manual thresholds and use custom SQL for your known issues
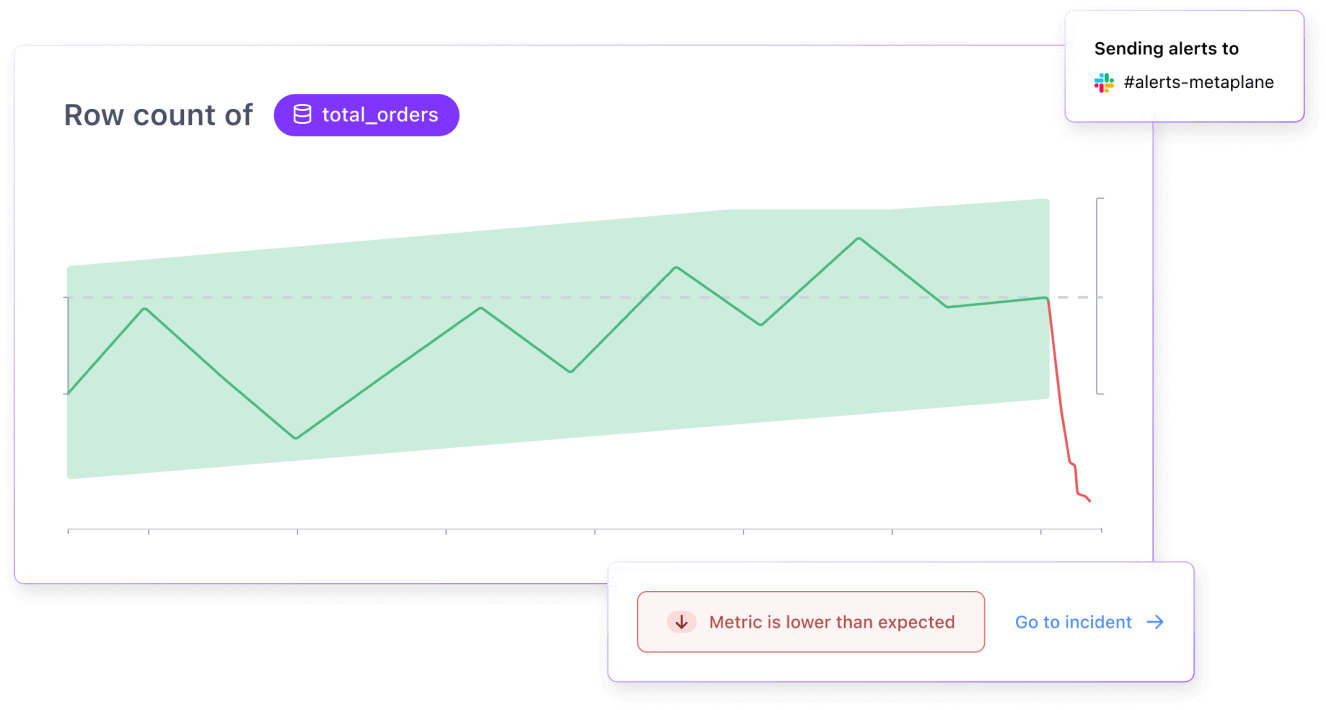
Machine learning-based monitors identify unknown issues
.png)
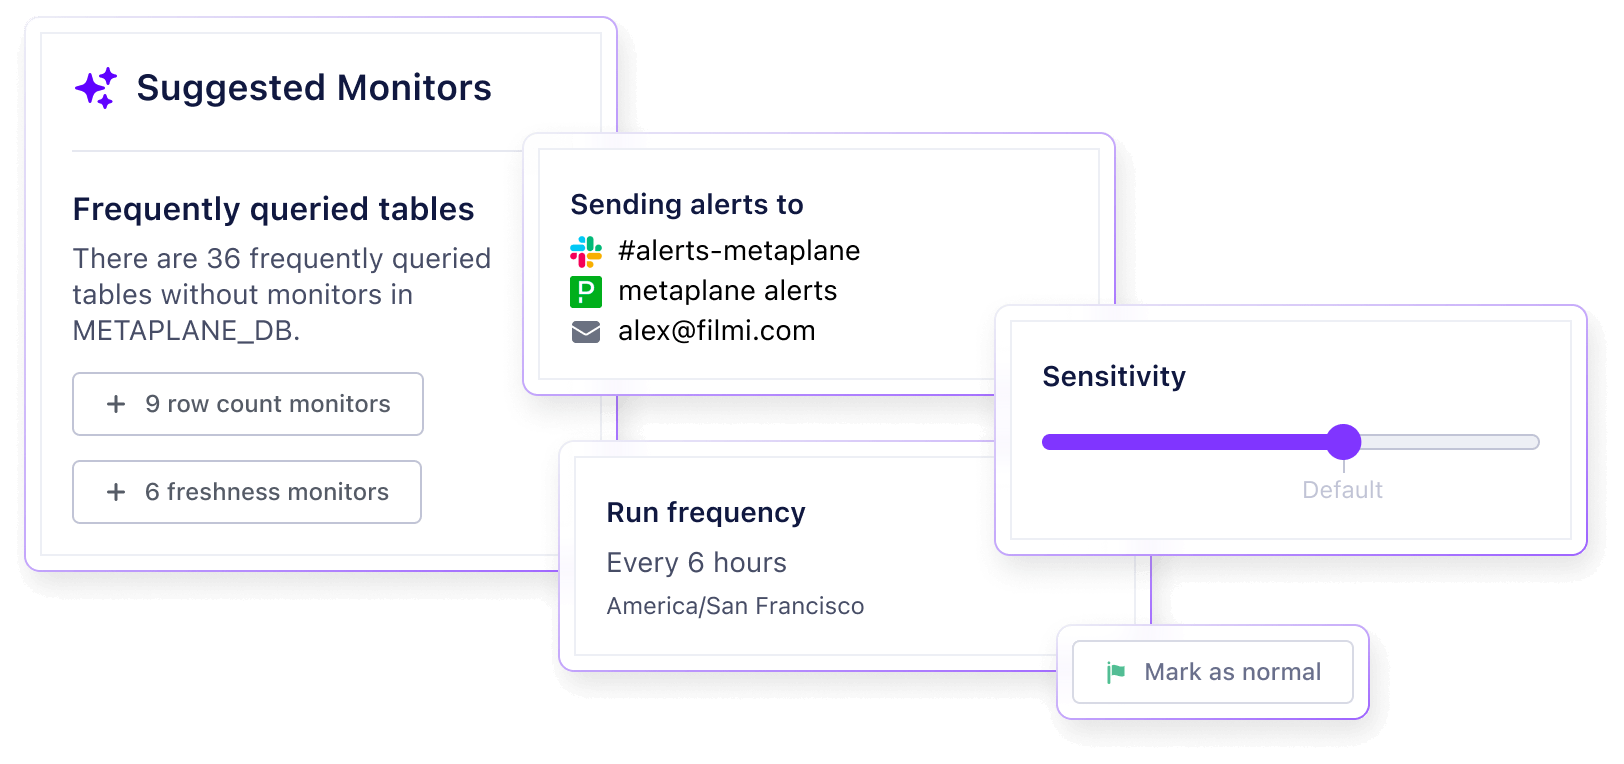
Leverage suggestions and customize to your needs
Configure monitors to find data quality issues within your table’s dimensions
Interact with models directly through sensitivity adjusting and feedback
Tailor monitored data through time windows and 'WHERE' clauses
How monitoring modeling works
Metadata from warehouses used for freshness and volume to limit compute
Deep data sampling queries used to find issues within your data
Sophisticated modeling works within 3 days and accounts for seasonality
.png)
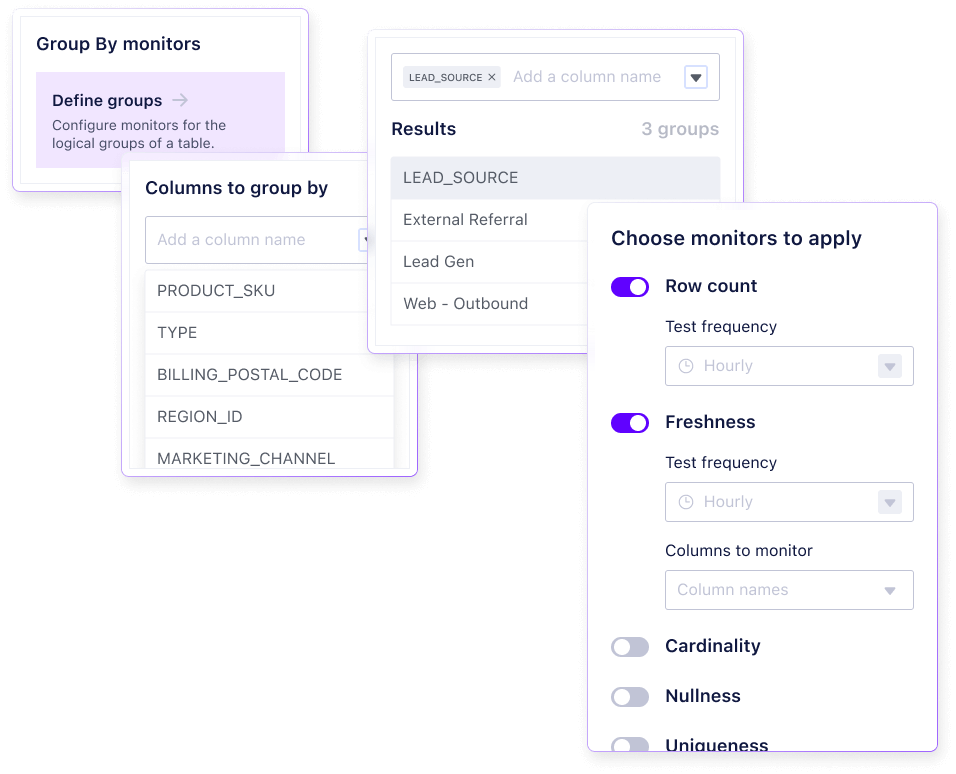
Monitor by different dimensions within a table
Monitor business metrics such as average revenue or mean by customer, at scale
Easily select one or more groupings without manually defining them in SQL
Avoid alert fatigue with our automated issue grouping
Monitor types
Metaplane supports the following types of monitors out-of-the-box, from monitoring row counts and freshness to mean and standard deviation.
.svg)
Row counts
Alerts on-changes to expected volume
Freshness
Alerts no longer than expected update times
Cardinality
Alerts on new or removed unique values
Nullness / Uniqueness
Alerts on changes to percentage nullness or uniqueness
Distribution
Alerts on changes to statistical properties like mean, min, max, standard deviation
Custom SQL
Alerts on anomalies for arbitrary SQL queries that return a number
Explore more of the platform
Schema change
Increase awareness for the entire data team
Alerting
Alerts where you work
Lineage
Understand the flow of data from source to usage
Integrations
Find integrated tool issues
Usage analytics
Prevent issues through finding early indicators / brittle points
Data CI/CD
Prevent data quality issues in PRs