

Filters and context for Incident page
Understand how to navigate Metaplane's latest Incident Page features to isolate specific incidents with recently released administrative features and prioritize fixes with usage context.

You notice a Slack notification out of the corner of your eye with a post from “Metaplane Notifications” in the “#p1-revenue-data-alerts” channel. The game is on - with Metaplane, you and your data team (and anyone else getting alerts from that Slack channel) were the first to know about this data quality incident. You notify the stakeholders who were using the revenue dashboards that they’re populated by bad data, and get to work fixing it.
Luckily, you have context into pull requests, queries, and successful transformation jobs associated with your incident, so you were able to resolve this incident in minutes, compared to the previous hour that triaging used to take. Even more luckily for your team, you decide to use some of this regained time to double check on their existing incidents.
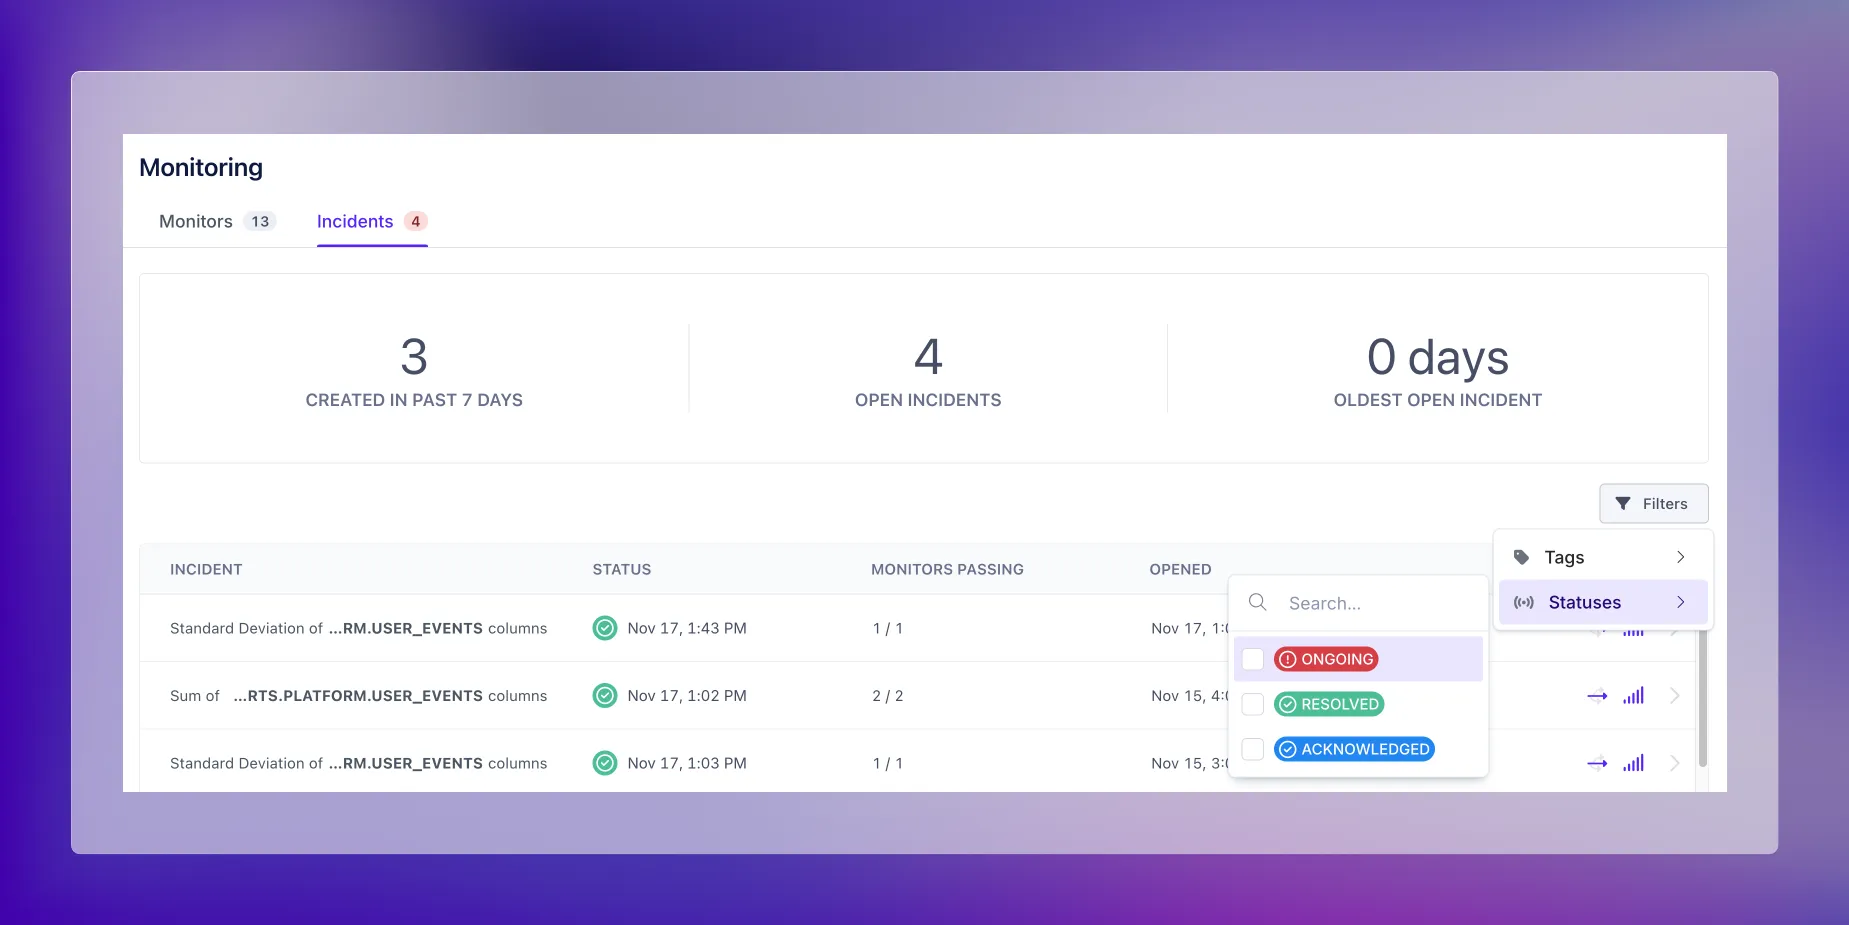
By navigating to the incident page, you’re immediately able to see top level stats on your metrics, such as the number of open incidents that you all have. Scrolling down further shows you specific incidents, sorted by when they occurred. Our latest features simplify the ability to search for particular incidents, which, in this case, means finding open or potentially open incidents related to revenue data.
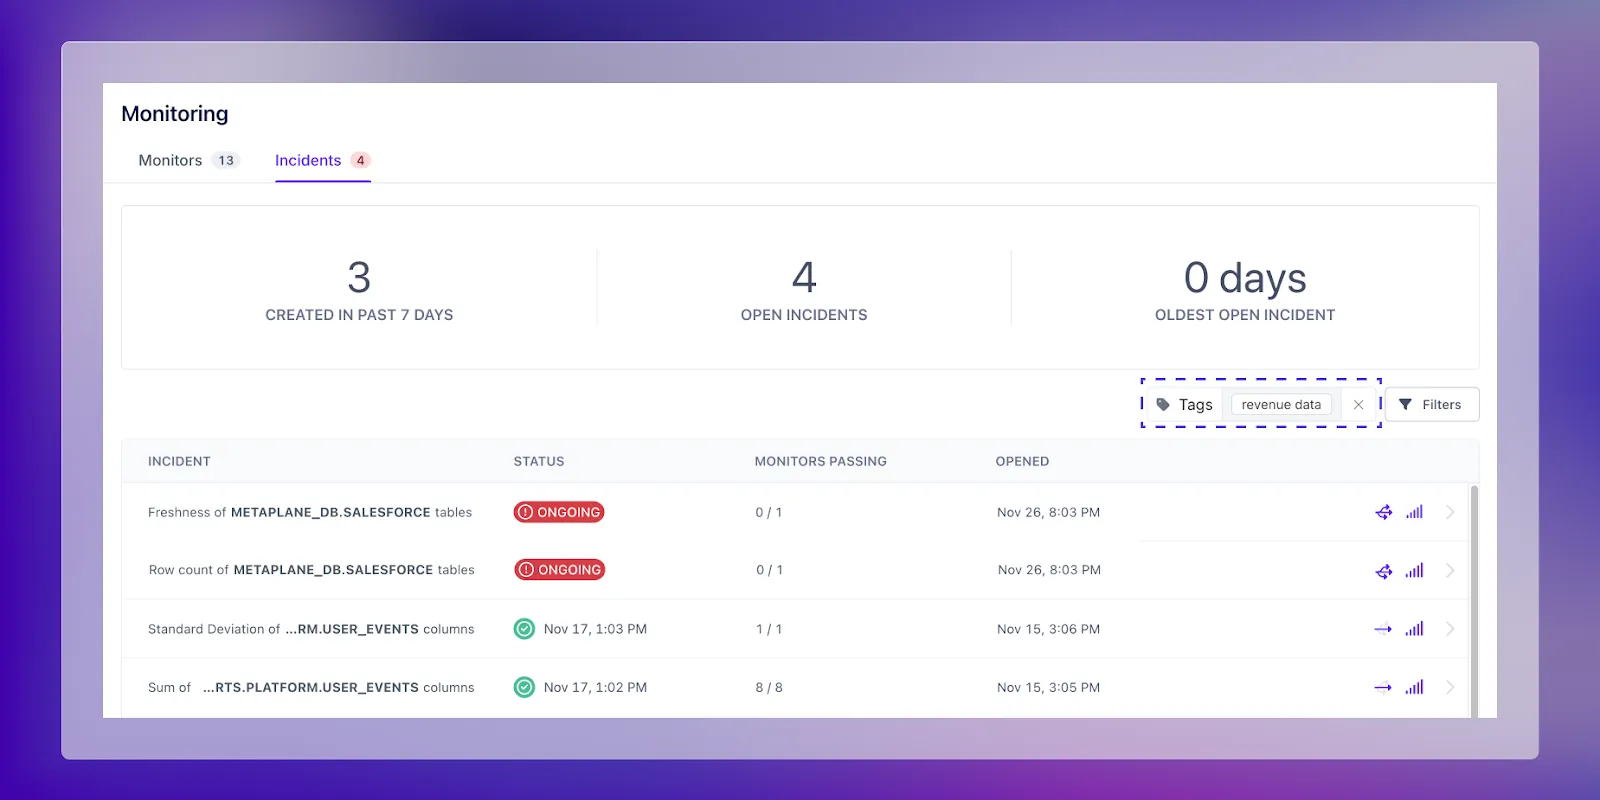
You want to drill down into any incidents related to “revenue-data” so you simply apply the tag in the filters, which shows you all of the data quality incidents associated with revenue data, either through a tagged object or a tagged data quality monitor.
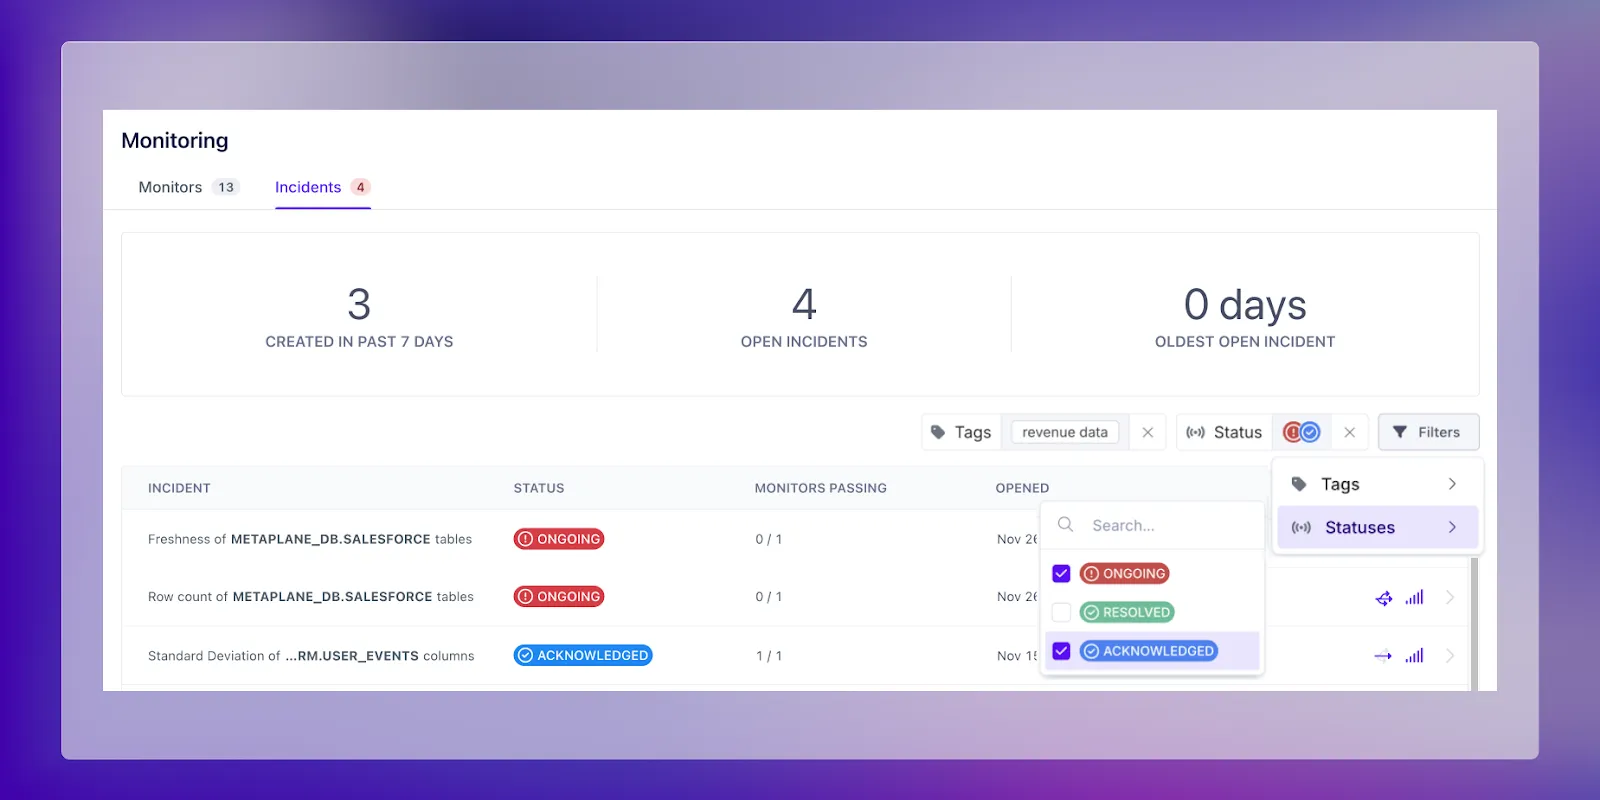
You then want to ensure that you’re looking at all ongoing or acknowledged incidents so that you can begin triaging, which you do through the secondary filter option.
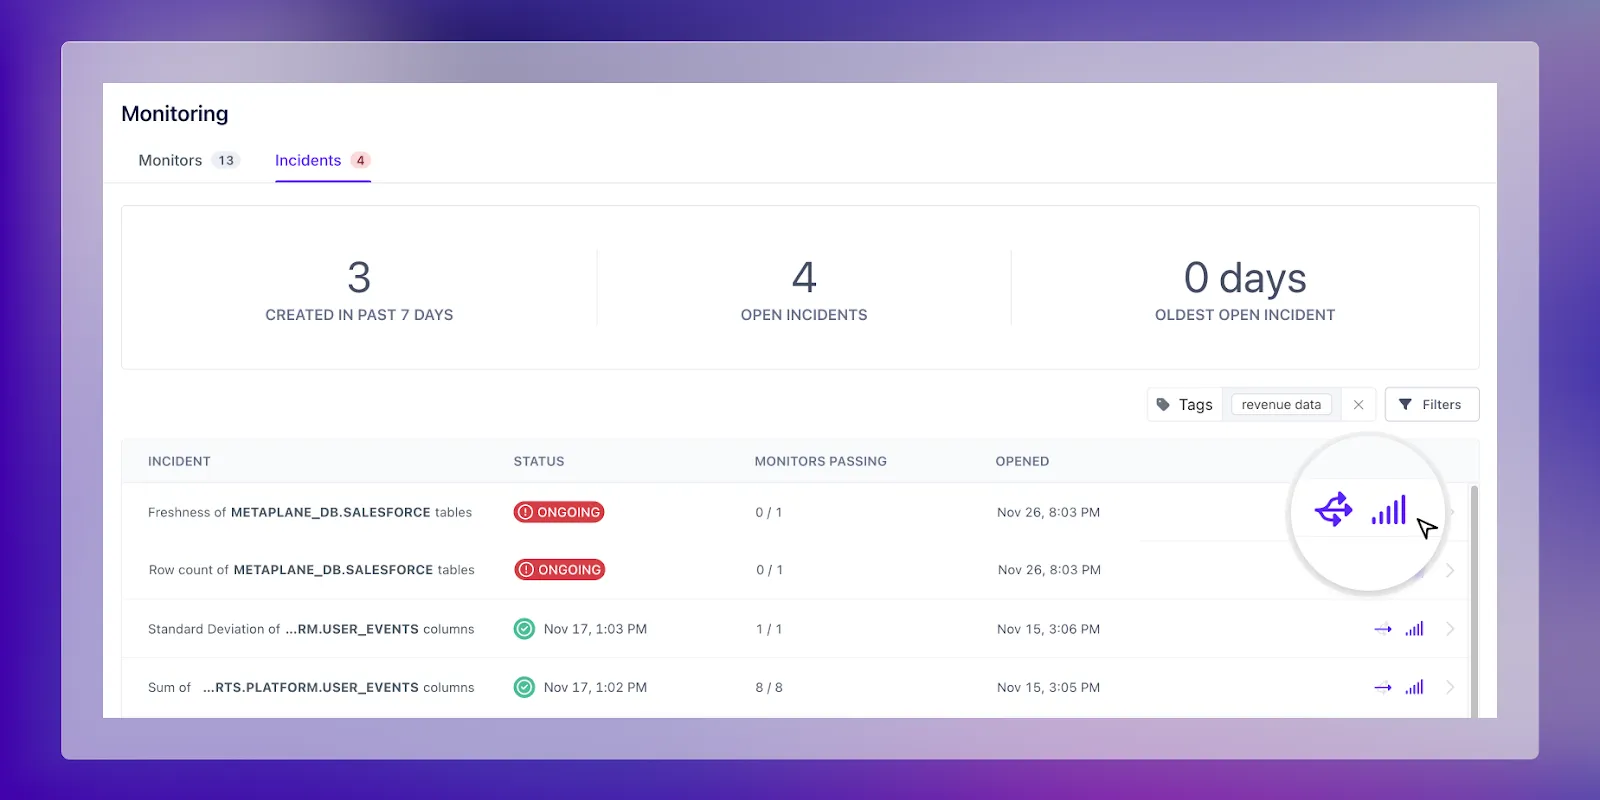
You now have a list of incidents on hand, ready for triaging and use the last highlight of the incident page, icons that identify “important” objects. These icons are the exact same that you’d see on your schema list page, alongside tables that are heavily queried and/or have downstream dependencies to help you figure out which of your incidents would result in the highest impact
A couple hours later and you’re now the talk of the data team after cleaning up their backlog of incidents!
Table of contents
Tags


...


...


