

How To Justify Investing in Data Observability
Data observability is emerging as a category to address problems of trust. But, as with all new categories, data teams often face the problem of justifying an investment into data observability.
This article provides the four most common reasons that our customers have shared for how they justified an investment into data observability, spanning concrete reasons to intangible (but still critical) reasons.


As modern data stacks click into place around the world, data teams empower their organizations to answer a universe of new questions with timely insights and operationalize their data to build better services for their customers.
With data in place and a culture of literacy to use data properly, data teams inevitably encounter the third pillar of a data-driven company: preserving trust.
Specifically, with data operationalized into marketing, sales, and success workflows, what happens if you send an e-mail to the wrong customer with the wrong information? With data used to train machine learning models, what if the model features drift over time? As stakeholders rely on dashboards to make decisions, what happens if the data is incorrect?
Data observability has emerged to help address these issues. But even if you are bought into data observability, convincing the broader team of the return on investing in data observability can be a challenge in itself. If these questions sound familiar, this article is for you:
- Didn't we already spend a lot of budget on a warehouse and a BI tool?
- Why don't we just build this internally if you just hired a data engineer?
- How do we measure the return on investment (ROI) of data quality?
🕰If your team is convinced of an investment, but you’re faced with the question “why can’t we just wait?”, we recommend reading this article on with arguments for why now instead.
1. Saving engineering time
Data roles are hard to fill. Searching through data roles on LinkedIn or scrolling through postings on a data Slack channel (we recommend the dbt and Locally Optimistic Slack channels) shows that many companies are trying to grow their data teams, but can't find enough data people to fill those roles.
As data people ourselves, we know how time-consuming questions in Slack from the Head of Marketing like "Why does this dashboard look broken?" can be. Data teams typically spend hours, upwards to dozens of hours a week across multiple people, addressing these sorts of questions. Assuming five hours a week on addressing data quality issues, and a conservative hourly rate of $50/hour, this cost can surpass over $10K a year on the low end spent addressing issues instead of moving the needle forward.
In concrete terms, how is time saved from a data observability tool? The main four buckets of improvements are to, first, decrease the frequency and, second, decrease the severity of data quality issues. This is a byproduct of increased data awareness and catching issues before they escalate. Third, data observability tools decrease the time to detect an issue. Fourth, they decrease the time to resolve an issue.
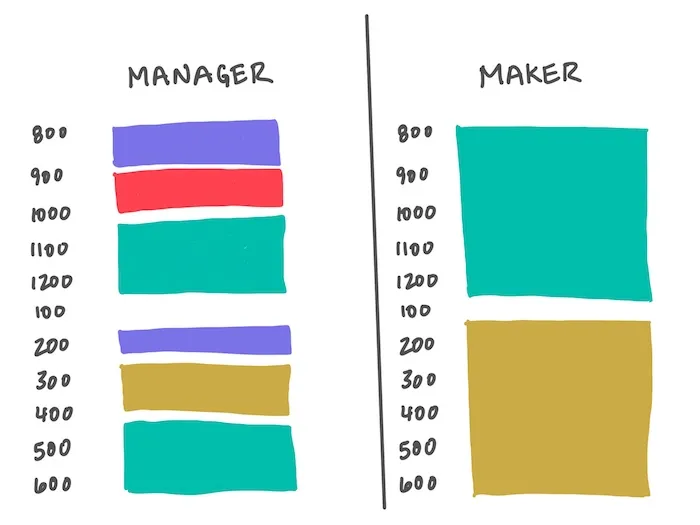
Not only are these questions time-consuming, but they can be incredibly disruptive. And as people on a maker's schedule, we know the impact of a fragmented schedule. Spending 30 minutes addressing a data quality issue in the middle of a day can spoil the focus of an entire afternoon.
🐞How is time-to-identification correlated with time-to-resolution? When silent data bugs occur and the data team doesn't address them immediately, the impact compounds over time. Incorrect data accumulates in downstream dependencies, poor decisions are made, and recovering previous state becomes even more difficult.
2. Increasing data team leverage
As data shifts from being a service organization that slings LookML to a product organization that empowers other teams, it's becoming untenable for team headcount to scale linearly with the number and depth of use cases of data. In fact, some of the most cutting-edge data teams at high-growth tech companies make an effort to keep head count as low as possible while investing in infrastructure and best practices to optimize the ratio of output/headcount.
Data observability tooling proposes to fill the "job" of continually monitoring data quality, collecting relevant context to debug and prioritize, and alerting the right people. In other words, for teams without a data QA person, data observability should be like data QA in a box. For data teams with a QA function, imagine multiplying the productivity of that person and, by extension, that of the rest of the team.
3. Avoiding costly lapses in data quality
A key use case of data observability is to preserve data quality. High-level estimates of data quality by Gartner propose that quality issues can cost $15 million per year for organizations. Across the US, IBM estimates $3.1 trillion per year in cost from bad data. Here are some poignant examples:
- Hawaiian Airlines mistakingly charging customers in dollars rather than miles, resulting in a $674,000 charge to one customer.
- The $125 million Mars Climate Orbiter being lost in 1999 because of an English measurement wasn't converted to metric units.

You may not be sending satellites into space, but you (and every data team) is running a complex system with many assumptions. The cost of that system breaking or those assumptions falling through depends on the company. Concretely, the expected cost of data quality depends on how data is used within the company, which no one knows better than you. A simple way to break down the expected cost is to multiply the probability of a quality issue (risk) with the total potential cost.
Here are some examples based on real-life cases to map to:
- An e-commerce company uses machine learning to recommend merchandise to a customer. That model is maintained by a large team of data scientists. Yet, because that model is a black box with high-dimensional inputs, it fails to recommend certain types of merchandise to customers. If potential lost revenue comes in to $100K/day for 5 days, and the risk of this particular model failure is 50% throughout all time, then the cost is 50% * $100K = $50K.
- A growth-stage SaaS company uses reverse ETL to send data into Salesforce, which contains an automation to automatically message product-qualified leads (PQLs). Because the product team changed the format of event names a week ago, new customers aren't logging events. As a result, potential PQLs. For a company with $50000 in new bookings every day ($18.250 ARR a year), a loss of 30% conversion for 3 days is a cost of $45K. If the risk of this failure is 100% at some point (if you've worked with product analytics data, you know this is realistic), then the cost is $45K.
- An investment group relies on external data loaded every day at the start of trading to make decisions using Airflow. Because their Kubernetes cluster maxed out on compute resources, the job failed to run in the middle of the night, and couldn't be restarted until three hours past start of trading. If the group employs 200 traders that cost $100 an hour, the employee downtime cost is $60K, not even thinking of opportunity cost. If the risk of this outage is 50%, then the cost comes out to $30K.
Keep in mind as you work through this exercise that there is rarely only one risk — there are usually multiple. Furthermore, we're only accounting for the known risks, not taking into account the (potentially even more costly) unknown risks.
4. Preserving trust
Trust takes seconds to lose and months to regain. While it's difficult to measure the value of lost trust, the impact can be massive. On an individual level, we hope you haven't been in the situation where a stakeholder finds out about a data quality issue before the data team and then you need to continually answer questions like "can I trust this now" while having to run proactive one-on-ones to rebuild. Furthermore, your stakeholders talk to each other and learn from one another. When one person, especially a decision-maker, is reluctant to trust data, they can influence their peers to do the same. This has the potential to snowball into a team or organization level cultural shift, where silos of data assets can pop up, further exacerbating the problem.
On an organizational level, the cost of lost trust is scary to contemplate. Not only is engineering time lost, leverage decreased, and data quality costs increased, but the efforts that your team invested in the data stack is essentially lost in a way that is costly to reverse. The cost of changing culture is immense.
Adding it all up
Here is the formula we come to:
ROI = (saved engineering time) + (value of multiplier on leverage) + (reduced risk) * (reduced downside cost) + (value of preserved trust)
%2013.02.52.webp)
For commercial offerings, we add a new component which is the time to implement and maintain a data observability solution.
+ (cost to build and maintain in-house)
To give a concrete example, a growth-stage, Series A SaaS company with a three-person data team might:
- Save five hours a week = 5 * $100 = $500/week = $2K / month
- Value of multiplier on leverage = $1K / month
- Reduced risks:
a. Value of reducing monthly 20% risk of $20K reputation and opportunity cost of sending wrong data to customer to 10% = 10% * 20K = $2K
b. Value of reducing 20% risk of $10K poor quality product data for product onboarding to 10% = 10% * 10K = $1K - Value of preserved trust = $1K / month
Adding up those components, the ROI of a data observability tool could come out to $7K/month, which given the rule of thumb that a SaaS offering should charge 10% of the value provided, results in justifying a $700/month spend (you keep the rest of the 90% of value).
A larger company has many more data people and parts in their data system, resulting in more frequent issues, more risks, and a higher premium on preserving trust. The ROI can easily come out to $50K/month, which is consistent with how enterprise customers value a tool like ours.
🛠What is the cost of building and maintaining in-house? It depends on how much observability you want to add across your data stack. The minimum in-house data observability tool we commonly see is an orchestration tool (such as Airflow) both sending metadata and the result of a suite of SQL queries into your warehouse, with a visualization and alerting layer (probably your existing BI tool) on top.
The upfront cost to setup such a system in a robust and meaningful way might be a two weeks of full-time work (40 * $100 = $8K), followed by 2 hours of maintenance per week to add new tests, fix errors, etc (2 * 4 * $100 = $800/month). This is a solid option for teams with a decent amount of bandwidth, interest, and extremely limited budget.
The cost of building a system with an intuitive UI, machine learning-based alerting, lineage integrations with BI/transformation tools, reporting, etc is substantially higher. Trust us, we’re building it! You probably shouldn’t invest in building a whole product unless you have a team dedicated to internal tooling or several people on your data team with full-stack engineering experience and a quarter to spare.
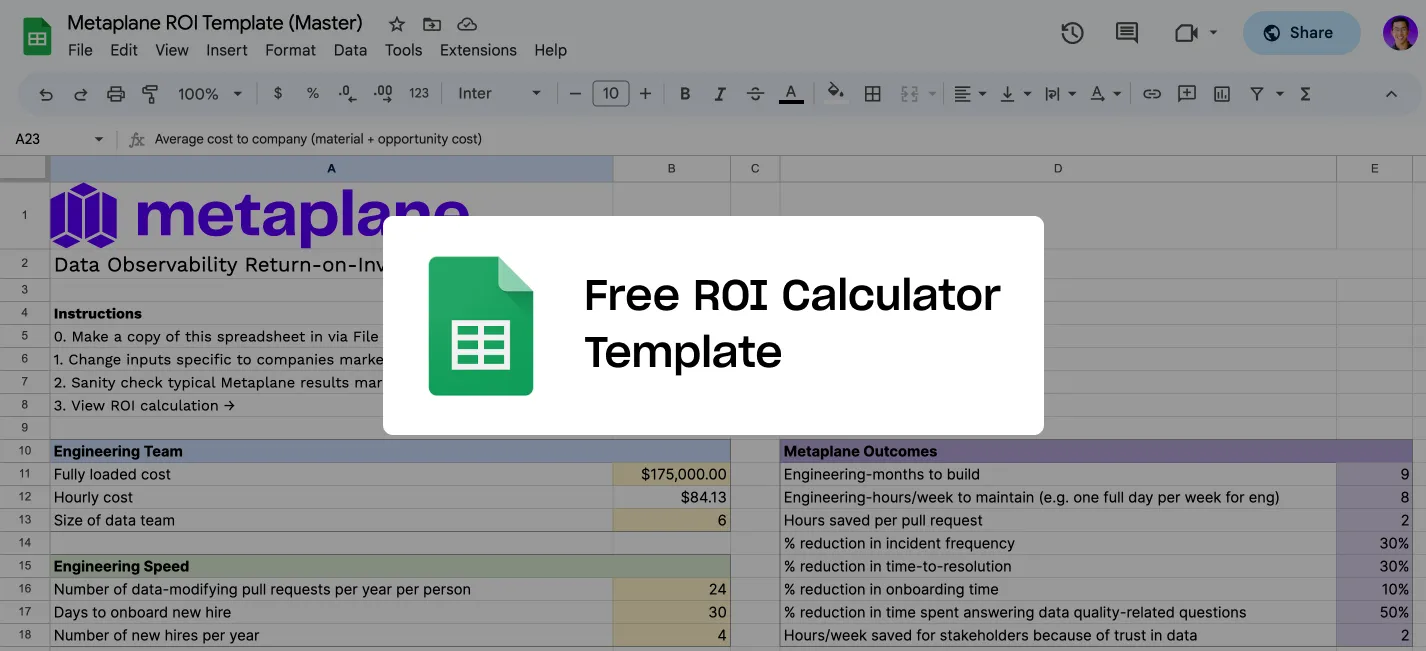
Telling the story
Sometimes the most convincing way to tell a story is with numbers. In which case, we've encapsulated some of the logic above into the spreadsheet template below that you can use to justify data observability. This is one piece of the puzzle for many of our customers.
But ultimately, persuasion is more of an art than a science, both for yourself and for the person you're convincing, as is pricing. Some of these numbers might have you asking "do I really value leverage?" or "is preserving trust actually worth that much?" What matters is for you to identify the reasons that resonate with you and your audience, boil that down into terms that are easy for your stakeholders to wrap their heads around (hint: execs care most about tools that increase revenue, save cost, or reduce risks), then to tell that story with both numbers and emotion. But we're preaching to the choir here because you're the expert on that 😊.
These four rationales form the vertebrae of your argument. But these tactics could drive the persuasion home:
- Surface a recent data quality issue. Did your customer reporting break? Bring it up!
- Appeal to an aspiration. Does your company admire companies like AirBnB that have prioritized data observability?
- Talk about how an observability investment helps them personally. Does your VP of data have to be accountable for data quality issues at a board meeting?
Decision-making is not an entirely rational process. Even if your boss doesn’t seem like it sometimes, we’re all humans at the end of the day, with each person wanting to improve the quality of their lives even when at work.
Summary
For what it's worth, we think justifying data observability will follow the trend of justifying software observability with tools like Datadog, Splunk, and SignalFx. Ten years ago, buying software observability tools required justification in similar terms of saving debugging time, preventing application downtime, preserving reputation with customers. Now, buying a software observability tool is a no-brainer. It is unimaginable for an engineering team to spin up critical infrastructure without observability. We imagine that, in the coming years, it will become a no-brainer for data teams to add data observability onto their future data stacks. Ultimately, if your company takes data seriously, it needs to take trust in data seriously.
Whether that data observability tool is something you build in-house, an open source option, or a commercial offering depends entirely on what you feel is right for your business. I'll plug that Metaplane is a good commercial option if you don't want to spend more on observability than on your warehouse. But even if you're not interested in trying us out (we offer 30 day free trials), if you could use a sounding board on how to make the case for investing in data observability, we'd love to chat with you.
Table of contents
Tags


...


...


