What Data Observability Is, What It’s Not, and Why it Matters

Data observability is arguably the hottest concept in the data space today. As a result, the term is frequently thrown around by excited and well-meaning data practitioners. However, few people we’ve encountered have a clear understanding of what it means.
It’s easy to understand why. After all, you can find countless sloppy definitions from vendors and investors online.
We wanted to clear things up, so we decided to write a blog post that defines data observability—what it is, what it’s not, and why it matters.
What is data observability?
To start, let’s take a look at how we define data observability:
💡Data observability is the degree of visibility you have into your data at any point in time.
Dedicated data observability tools like Metaplane collect metadata about the properties of and relationships between your data, then monitor everything for changes and present actionable insights. You could call data observability analytics for your analytics.
To make our definition easier to understand, we’ve broken it down into three constituent parts:
1. “the degree of visibility you have”
We define visibility in terms of the number of closed-ended questions a data team can answer. These questions might be yes-no questions or merely questions that have specific answers.
Here are a few examples of closed-ended questions you can answer with an end-to-end data observability tool, for example about taking inventory of your ecosystem:
- How many dashboards exist within my company?
- How many data sources does my company have?
- Are my ETL jobs all running?
Or for tracing dependencies:
- Which tables and columns in my data warehouse feed into this dashboard?
- How many dashboards does this column support?
- Which files in my data lake can I deprecate?
Or tracking usage:
- Which users access this dashboard each week?
- How are my data products being used?
Or ensuring desired state:
- Is this value or row count within the accepted range?
- When was the last time we retrieved data from this API?
- Are key metrics being updated in a timely fashion?
2. “into your data”
Even if your data sources are up and your data systems are running properly, the content of those systems—the data itself—can still be incorrect. (We call these silent data bugs.) For this reason, it’s important to have insight into the data, not just the data system.
One caveat here is that data systems often impact the quality of the data contained inside them. If there is system downtime, there will be data downtime and bad data as a result. However, the two concepts are generally distinct.
3. “at any point in time”
As a data engineer, it’s important to be able to zoom into your data at any point in time. Otherwise, you wouldn’t be able to tell if anything was different today from yesterday.
Historical baselines are important for three reasons:
- A historical baseline allows you to train machine-learning models that compare the current state of your data with its prior state. The thing is, data is always changing—if it didn’t, it wouldn’t be relevant or interesting. The models we use to understand and analyze our data therefore must adapt over time. The most powerful way to do that is to compare current data to historical data.
- A historical baseline allows you to detect anomalies present in any given data set. When an incident is flagged, the first thing you verify is whether the data point is within the expected range, which requires you to know what the expected range is. Historical context thus affords data teams the ability to debug efficiently and effectively.
- A historical baseline allows you to forecast the future state of your data. You certainly want to keep tabs on your data today, but you also want to know how it’ll look this weekend, when you’re away on vacation, or next month, when you’re projecting your annual cloud costs. The best way to know how things will be in the future is to know how they’ve trended in the past.
{{inline-a}}
What isn’t data observability?
Data observability isn’t data quality, data monitoring, or data testing. These three concepts differ significantly from the meaning of data observability. Keep reading to learn how.
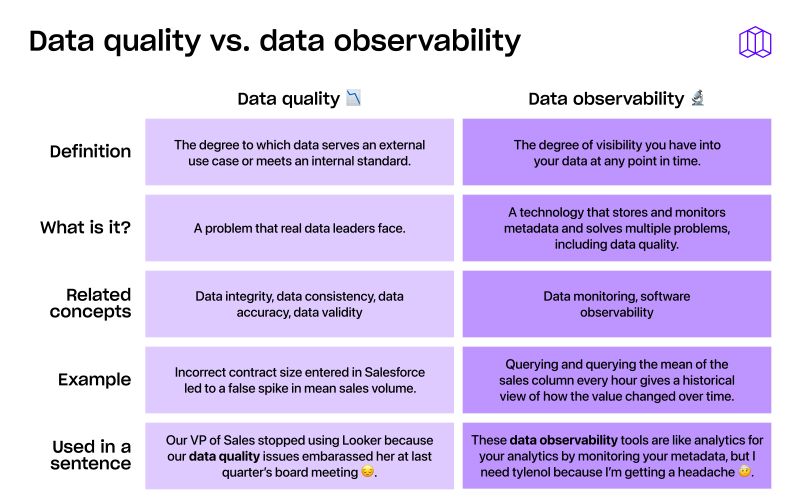
Data observability vs. data quality
Most of us intuitively know what data quality means, but a reminder never hurts.
Here’s our working definition:
💡Data quality is the degree to which data serves an external use case or meets an internal standard.
In an ecosystem where data observability software companies publish endless amounts of content about improving your data quality, it’s no wonder why some data engineers mistake the two terms for synonyms. Data observability and data quality also get confused because they share at least one goal: to increase stakeholder trust in an organization’s data.
One important differentiator between the two terms is that data quality is a problem, whereas data observability is a solution.
Data team leaders aren’t kept up at night thinking about data observability, but thoughts of data quality issues may in fact haunt them. They may dread the next morning, worrying that they’ll wake up to a WTF message from one of their key stakeholders, questioning whether they can trust their data.
Data observability is a technology that can solve data quality problems. That said, it’s not the only solution. Data quality issues can also be prevented through thoughtful applications of people and processes, or through data unit testing and data regression testing.
Similarly, solving data quality issues to increase data reliability isn’t the only application of data observability tools. Valuable use cases within data management and DataOps include impact analysis, root cause analysis, spend monitoring, usage analytics, schema change monitoring, and query profiling, among others.
As Datateer’s CEO Adam Roderick so eloquently put it, “Data observability solves multiple problems, with data quality being one of them.”
For example, Vendr’s analytics engineering leader Erik Edelmann uses Metaplane’s data observability platform for real-time anomaly detection powered by machine learning, which can help data engineers identify data quality issues, but he also uses it to conduct impact analyses.
In the past, Erik had to intentionally break something in dbt to see how it affected the corresponding Looker dashboards, and write separate queries to figure out usage patterns. Now, he leverages Metaplane’s data lineage feature to identify which dashboards would be affected by upstream changes and its usage analytics feature to determine whether said data assets are still relevant to the company’s business users—an investigation that takes seconds, not hours or days.
“The combination is a dream,” shared Erik. “One or the other is great, but together they’re greater than the sum of their parts.”
Data observability vs. data monitoring
These two concepts are closely related, but data monitoring has a slightly different connotation than data observability. Plus, the way it’s used in practice is quite different.
Here’s our working definition of data monitoring:
💡Data monitoring informs you whether specific pieces of metadata are within their expected range.
Data monitoring requires data teams to do the work up front, specifying which metrics they care about enough to monitor.
Data observability inverts this process. It collects and tracks all of your metadata over time, giving you a historical record—should you ever need it. When the time comes to monitor your data, you already have a baseline to compare it against.
This approach has two benefits: The first is obvious—you don’t have to know what matters up front. The second is that you gain coverage of your entire data stack, which is important because data issues don’t occur in a silo. If one piece of upstream data is problematic, there’s likely at least one problem downstream. Data observability thus gives you more metadata to perform root cause analysis and debugging.
Data observability vs. data testing
Because these two terms have substantial overlap, you may be confused about how they differ.
Let’s start with our working definition of data testing:
💡Data testing is a method for validating assumptions about your data at specific points in your data pipeline.
Data testing is frequently used to examine the quality of your data. Say, for example, that you wanted to verify whether a specific data set is up-to-date. You could conduct a freshness check with a unit test.
At Metaplane, we’ve spoken with hundreds of data-first companies. While some acknowledge data quality issues during our first conversation, plenty of others mistakenly believe they’re immune (or close to it). However, soon after they implement Metaplane, they realize that they have many more data quality issues than expected. They simply didn’t have the visibility they needed to understand what problems existed.
This experience suggests a dichotomy exists between known data quality issues and unknown data quality issues.
As an example, take a dashboard that was last updated three days ago, despite the fact that it’s supposed to update every hour. If no one looks at the dashboard, it would be considered an unknown data quality issue. Once a business user takes a look, and subsequently flags the issue to the data team, it would be considered a known issue.
Data testing is designed for testing known issues—whether those issues occurred in the past, or you have a strong suspicion they’ll occur in the future—against known expectations, in one part of your data pipeline.
The problem is that data issues don’t occur in a silo, and not all issues that occur in the future have occurred in the past.
Data observability is designed for testing unknown issues, in ever-changing data, against evolving expectations, across your entire data stack.
Why is data observability important?
We already know that data increases revenue, decreases costs, and mitigates risks for businesses by helping them make better decisions and take effective actions. At the end of the day, data observability matters because it empowers data teams to provide the high-quality data businesses need to accomplish these goals.
The how is where it gets interesting.
Despite supplying other teams with the data they need to inform their decisions and fuel their operations, the data team lacks the data they need to perform their jobs efficiently and effectively. This data, which is called metadata because it’s data about data, is difficult (but not impossible) to collect and track without a data observability platform.
Data teams with data observability tools leverage their historical metadata to complete the following mission-critical jobs:
- Data quality monitoring: Is the state of our data sufficient to meet the needs of external use cases and internal standards?
- Root cause analysis: When a data quality issue occurs, what upstream dependencies caused it to happen (and how fast can the problem be resolved)?
- Impact analysis: What are the downstream consequences of a data quality issue, when one does occur? Which downstream teams, like a data analytics team or data scientists, should be notified?
- Spend monitoring: How much money are we spending, and how is it provisioned across our data stack?
- Usage analytics. By whom, when, how much, and in what manner are our data assets being used by stakeholders?
- Query profiling: How can I optimize both my data assets and stakeholder queries to minimize time and cost?
- Data governance: How can I gain an overall view and control of my data health for faster development by data engineering teams and greater trust for decision-making?
Data observability thus helps data teams deliver on their mandate to provide the high-quality data businesses need to grow.
A recap of what we’ve learned
In summary, data observability is the degree of visibility you have into your data at any point in time. It’s distinct from related concepts, like data quality, data monitoring, and data testing.
Whereas data quality is a problem, data observability is a suite of solutions that improve data quality while helping data engineers complete other jobs, such as root cause analysis, impact analysis, spend monitoring, usage analytics, and query profiling.
Whereas data monitoring requires data teams to specify which metrics they want to monitor up front, data observability offers a historical record of your metadata and layers monitoring on top of it.
Whereas data testing is designed for testing known issues against known expectations in one part of your data pipeline, data observability is designed for testing unknown issues in ever-changing data against evolving expectations across your entire stack.
Data observability matters because it empowers data teams to provide the high-quality data businesses need to make better decisions and take effective actions, which are critical to improving business profitability and ensuring a company’s longevity.
To learn more about the many applications of data observability, and how it can be tailored to your unique business needs, sign up for a demo.
Table of contents
Tags
...

...


