What is Data Observability? The Definitive Guide
If you work in data, you’ve likely heard the term “data observability” floating around. But what exactly is data observability, and why does it matter?
In this definitive guide, we’ll break down the components of data observability, its importance for modern data stacks, and the top strategies and tools for implementing it effectively.

What is Data Observability?
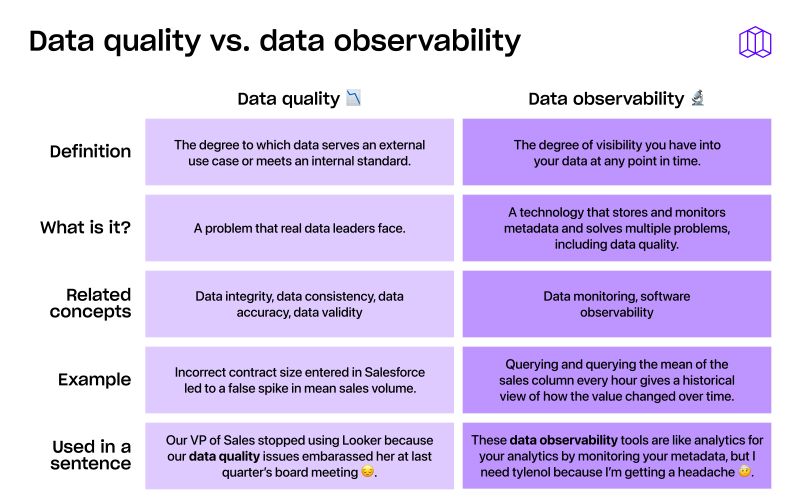
📖Data observability is the degree of visibility you have into your data at any point in time. As a practice, it includes monitoring, troubleshooting, and ensuring data quality throughout the data stack.
The concept is an extension of software observability, which itself comes from control theory, wherein it refers to the ability to infer the internal state of a system based on its external outputs.
In data observability, this concept is applied to the data stack and can address use cases like data quality, spend monitoring, usage analytics, and preventing data issues — allowing data teams to gain insight into the health and quality of their data without needing to actively dig into individual components.
Why Data Observability Is Necessary
Accurate and timely data is more important than ever. Data observability plays a critical role in ensuring that data is available, accurate, and trustworthy.
Common data issues, such as data inconsistency, outdated or incorrect data, and data silos, can be addressed with data observability. Additionally, data observability can help businesses make more informed decisions by providing a clear picture of the context and quality of their data.
For example, your organization might rely on an `activated_users` table to send targeted marketing e-mails. When the data in this table becomes inconsistent or outdated, your marketing campaigns could suffer. With observability into your data, you can monitor the freshness and accuracy of this data, ensuring that your campaigns are always on track.
The Four Pillars of Data Observability
How can we derive the state of our data at any point in time? Although there are an unlimited number of properties that might be useful, they can all be grouped into four pillars of data observability: metrics, metadata, lineage, and logs.

1. Metrics: internal characteristics of the data
Metrics are internal characteristics that describe some aspect that summarizes the underlying data, whether they’re calculated for data tables at rest in a warehouse or data in transit in data pipelines. They include:
- Accuracy: Does this data correctly describe the real world?
e.g. How accurately does this `revenue` column in the `revenue_by_month` table match the actual revenue every month?
- Completeness: How complete is the description of the real world?
e.g. How many values are empty or null in this `email` column in the `users` table?
- Consistency: Is the data internally consistent?
e.g. Do values in this `revenue_by_week` table equal the sums of `revenue_by_day` for the corresponding time period?
- Privacy and security: Is data being used in accordance with the intended level of privacy and secured against undesired access?
e.g. Is the `address` column in the `users` table, known to be personally identifiable information (PII), being exposed to all database users?
- Freshness: Does the data describe the real world right now?
e.g. How long has it been since the `daily_revenue_table` was updated?
2. Metadata: external characteristics about the data
While intrinsic data quality dimensions can be reasoned about without talking to a stakeholder, extrinsic data quality metrics depend on knowledge of the stakeholder and their use case. These use cases can be analyzed like product requirements: they have a specific purpose, with informal requirements, trust requirements, and a time constraint. They include:
- Relevance: Does the available data meet the needs of the task at hand?
e.g. Does all available revenue data allow the Head of Sales to know how well sales reps are performing?
- Reliability: Is the data regarded as true and credible by the stakeholders?
e.g. Does the Head of Marketing trust the monthly leads report?
- Timeliness: Is the data up-to-date and made available for the use cases for which it is intended?
e.g. If your CEO expects the daily cashflow to be up to date within 12 hours, how often is that true?
- Usability: Can data be accessed and understood in a low-friction manner?
e.g. The Tableau dashboards exist for customer support teams to understand how well they’re performing, but it’s too difficult to read and interpret.
- Validity: Does the data conform to business rules or definitions?
e.g. Is revenue being calculated in the same way in reporting for both sales and accounting?
3. Lineage: relationships between data
Using metrics and metadata, we can describe a single dataset with as much fidelity as we desire. However, datasets in the real world often do not exist in isolation, landing in a data warehouse with no relationship to each other.
Within the data world, the primary internal interaction is the derivation of one dataset from another. Datasets are derived from upstream data, and can be used to derive downstream data. These bidirectional dependencies are referred to as the lineage of data (also called the provenance), and range in level of abstraction from lineage between entire systems (this warehouse depends on those sources), between tables, between columns in tables, and between values in columns.
4. Logs: relationships between data and the real world
With metrics describing the internal state of data, metadata describing its external stage, and lineage describing dependencies between pieces of data, we’re only missing one piece: how that data interacts with the external world. We break these interactions into machine-machine interactions and machine-human interactions.
Machine-machine interactions with data include movement, like when data is being replicated from data sources like transactional databases or external providers to an analytical warehouse by an ELT tool.
Interactions also include transformations, for example when a dbt job transforms source tables into derived tables. Logs also document attributes of these interactions, for example the amount of time that a replication or transformation takes, or the timestamp of that activity.
Crucially, logs capture machine-human interactions between data and people, like data engineering teams creating new models, stakeholders consuming dashboards for decision making, or data scientists creating machine learning models. These machine-human interactions contribute an understanding of who is responsible for data and how data is used.
Data Observability Use Cases
Data observability plays a crucial role across a wide spectrum of teams and roles within a data-driven organization. Its applications are not limited to certain teams; instead, they permeate every function, leading to a more informed and robust strategy and execution.
Data Engineer
For data engineers, the ability to observe and understand the data's journey from its origin to its final destination is vital. Data observability allows them to monitor the entire data pipeline and quickly identify any issues or bottlenecks. It also aids in ensuring the data is properly transformed and loaded into the destination system, maintaining its quality and usability.
Data engineers may be the first point of contact when a data quality issue arises downstream, but are also involved in debugging those issues. Having observability means data engineers can find issues before stakeholders do, and ensures both trust in the data and trust in them.
Analytics Engineer
Analytics engineers design and build data models via tools like dbt to support various business functions. Data observability enables them to ensure these models are functioning correctly and producing the expected results. It also allows them to keep an eye on the models over time to detect any deviations or anomalies that may indicate a problem.
Data Analyst
Data analysts can benefit greatly from being supported by a data team that has data observability as it ensures the accuracy and reliability of the data they work with daily. It helps them identify any discrepancies in data and ensure the integrity of their reports. For instance, if they're generating weekly performance reports, data observability tools can ensure the data they're pulling is accurate and updated, leading to more valid insights and recommendations.
Head of Data
For the Head of Data, data observability is a boon. It provides a high-level view of the entire data landscape and can highlight areas that require attention. It can also provide assurance that the data infrastructure is reliable, accurate, and provides a solid foundation for decision-making. This can foster trust and confidence in data-driven decisions and strategies among the C-suite and other peer stakeholders.
Software Engineers
Software engineers have long cared about software observability, but tools in that space like Datadog or Splunk may not provide complete insight into the state of data, which can affect software systems if the data is being used by them. This is especially true with datasets for machine learning, where complex algorithms and models are highly dependent on the quality of data fed into them. Data observability can help ensure that the data used in machine learning algorithms is up to date and accurate, leading to more reliable predictive models and AI systems.
Marketing, Sales, and Product Teams
Data observability is not just confined to the realm of data teams. Marketing, Sales, Support, and Product also reap the benefits of data observability. For example, Marketing teams can automate and optimize email campaigns based on accurate customer segmentation data, Sales teams can make informed hiring decisions based on revenue data, and Product teams can use data observability to generate features for machine learning models embedded within products.
Ultimately, data observability impacts overall business strategy by ensuring trust in data for decision-making.
What Data Observability Tools Do
Ensuring data quality through observability can be a challenging task. Fortunately, a range of powerful tools is available today that can significantly simplify and enhance this process.
While some aspects of data observability require process and communication within your team, there are several use cases you can expect a tool to help with:
Anomaly Detection
Anomaly detection is vital for maintaining data quality. Data observability tools can help detect anomalies across two broad categories:
Metrics: Tools can monitor key performance indicators and other metrics continuously. When these metrics deviate significantly from their typical patterns, the system can trigger alerts to notify your team. This automatic detection enables you to react quickly to potential data quality issues and prevent their downstream effects.
Metadata: Metadata holds essential information about your data and its transformations. Data observability tools can monitor different types of metadata such as:
- Job Metadata: This includes information about data processing jobs like run time, job status (success/failure), and job duration. Changes in these can often indicate anomalies.
- Spend Metadata: This refers to the cost incurred during data processing. A sudden spike or drop might be indicative of issues like inefficient resource utilization or job failures.
- Schema Changes: A sudden or unexpected change in the data schema can disrupt downstream applications. Tools can monitor schema changes and alert the team when such changes occur.
Data CI/CD and Regression Testing
Data observability tools play a critical role in implementing a robust data CI/CD (Continuous Integration/Continuous Deployment) pipeline to prevent data quality issues from occurring in the first place. They allow for regular, automated regression testing—verifying that new changes or additions haven't broken any existing data pipelines or affected data quality negatively. These tools can also facilitate the rollout of changes in a controlled manner, allowing for better version control and making the reversal of changes easier in case of an issue.
Lineage
Understanding the journey of your data—where it originates, how it's transformed, where it's used—is key for data troubleshooting and maintaining data quality. Data observability tools can help visualize data lineage, allowing your team to track the lifecycle of data and gain insights into its transformations and dependencies. This feature is crucial for root cause analysis when issues occur, but can also be used proactively to understand what may impacted by a proposed change, or to understand whether data can be safely removed.
Usage Analytics
Data observability tools can provide insight into how your data is being used. They can track which data sets are frequently accessed, who are the primary users, which queries are often run, and which data is currently unused. This helps identify important data sets and optimize resource allocation while reducing the surface area of possible problems. Additionally, usage analytics can reveal patterns of misuse or abuse, facilitating proactive data governance.
Best Data Observability Tools
Three platforms, in particular, stand out for their robust capabilities and focus on modern data stacks: Metaplane, Monte Carlo, and Datafold.
- Metaplane: Metaplane is a data observability platform that is designed to be powerful, yet easy to set up, with a feature set covering ML-based anomaly detection, proactive regression testing, and column-level lineage. Metaplane is the data observability platform used by the most data teams, is the only platform with a free plan, and allows you to get completely set up by yourself in minutes.
- Monte Carlo: Monte Carlo is a data observability platform that focuses on reducing data downtime and offers a number of features for proactively monitoring data. It supports older data stacks, but implementation takes time since a sales process is involved.
- Datafold: Datafold is an automated testing tool for data engineers. It focuses on data diffing, which helps compare data across different environments or points in time. Datafold does this more comprehensively than any other platform, but doesn’t offer tooling that covers other aspects of data observability.
Build vs. Buy
When it comes to implementing data observability, there’s a choice to be made between building an in-house monitoring solution and buying a managed data observability tool. Here are some specific use cases where building in-house is possible, and how a data observability tool could help instead:
Monitoring
- Building: Open-source libraries such as Great Expectations and dbt allow you to define, create, and validate data expectations that can be run as tests. However, building a comprehensive monitoring system with these tools requires significant effort, extensive coding skills, and ongoing maintenance. Importantly, these types of tests are run against hardcoded values, rather than predictive expectations. Because each one takes time, teams often have a limited number of tests, which may also become out of date.
- Buying: Data observability tools offer out-of-the-box monitoring capabilities, allowing you to track data pipelines in real-time with anomaly detection and root cause analysis. They use historical data to train machine learning models, so that monitoring is easy, more accurate, and used more widely. This drastically reduces the time and resources needed for comprehensive data monitoring.
Alerting
- Building: After monitoring with scripts, you can be alerted on important events by extending those scripts, using cron jobs, or other automation/orchestration tools. Slack and MS Teams have webhooks that can be used to send notifications there, and you can enrich or customize the message as needed.
- Buying: Connecting to a Slack channel or specific email addresses are offered out-of-the-box, and tools like Metaplane can incorporate buttons to take actions so that alerts can be acknowledged or muted, or to provide feedback to the machine learning models on how to treat the alert.
Data CI/CD
- Building: Datafold’s datadiff plugin can be used to run data diffs anywhere in the build or deploy process, but requires configuration.
- Buying: Datafold also offers a managed service that includes comprehensive data diffing within Github PRs. Metaplane integrates data CI/CD into its broader data observability platform, providing an understanding of how the data is changing like Datafold, but also including data downstream impact analysis for every pull request as a PR comment and CI check within Github. These tools simplify the process and ensure that data changes are properly validated before being deployed.
Lineage
- Building: Open-source projects like OpenMetadata and OpenLineage/Marquez can be used to construct data lineage diagrams. However, setting up, customizing, and maintaining these systems can be quite complex.
- Buying: Data observability tools like Metaplane offer column-level lineage (including visualization) out of the box in minutes by parsing SQL when relevant layers of the data stack are connected. This takes the work out of building out lineage, while also improving maintainability, and usability with a UI for exploring.
As shown above, custom in-house solutions require significant time and resources to build, and can quickly become outdated as the data stack evolves.
On the other hand, buying a data observability tool can provide a range of benefits, including reduced time-to-value, easy integration with existing tools, and ongoing updates and improvements as the data stack evolves.
Closing Thoughts
Data observability is a critical aspect of modern data stacks, providing data professionals with the ability to monitor and troubleshoot data quality issues throughout the stack. By leveraging the key components of data observability, businesses can make more informed decisions and ensure that data is accurate and timely.
At Metaplane, our data observability platform is designed to make implementing data observability simple and straightforward. With a focus on user-friendliness and transparency, our platform provides a range of monitoring and troubleshooting tools designed for the modern data stack. Sign up for Metaplane today, or book a demo.
Table of contents
Tags
...

...


